Email Health Report
- 31 Mar 2024
- 2 Minutes to read
- Print
- DarkLight
- PDF
Email Health Report
- Updated on 31 Mar 2024
- 2 Minutes to read
- Print
- DarkLight
- PDF
Article Summary
Share feedback
Thanks for sharing your feedback!
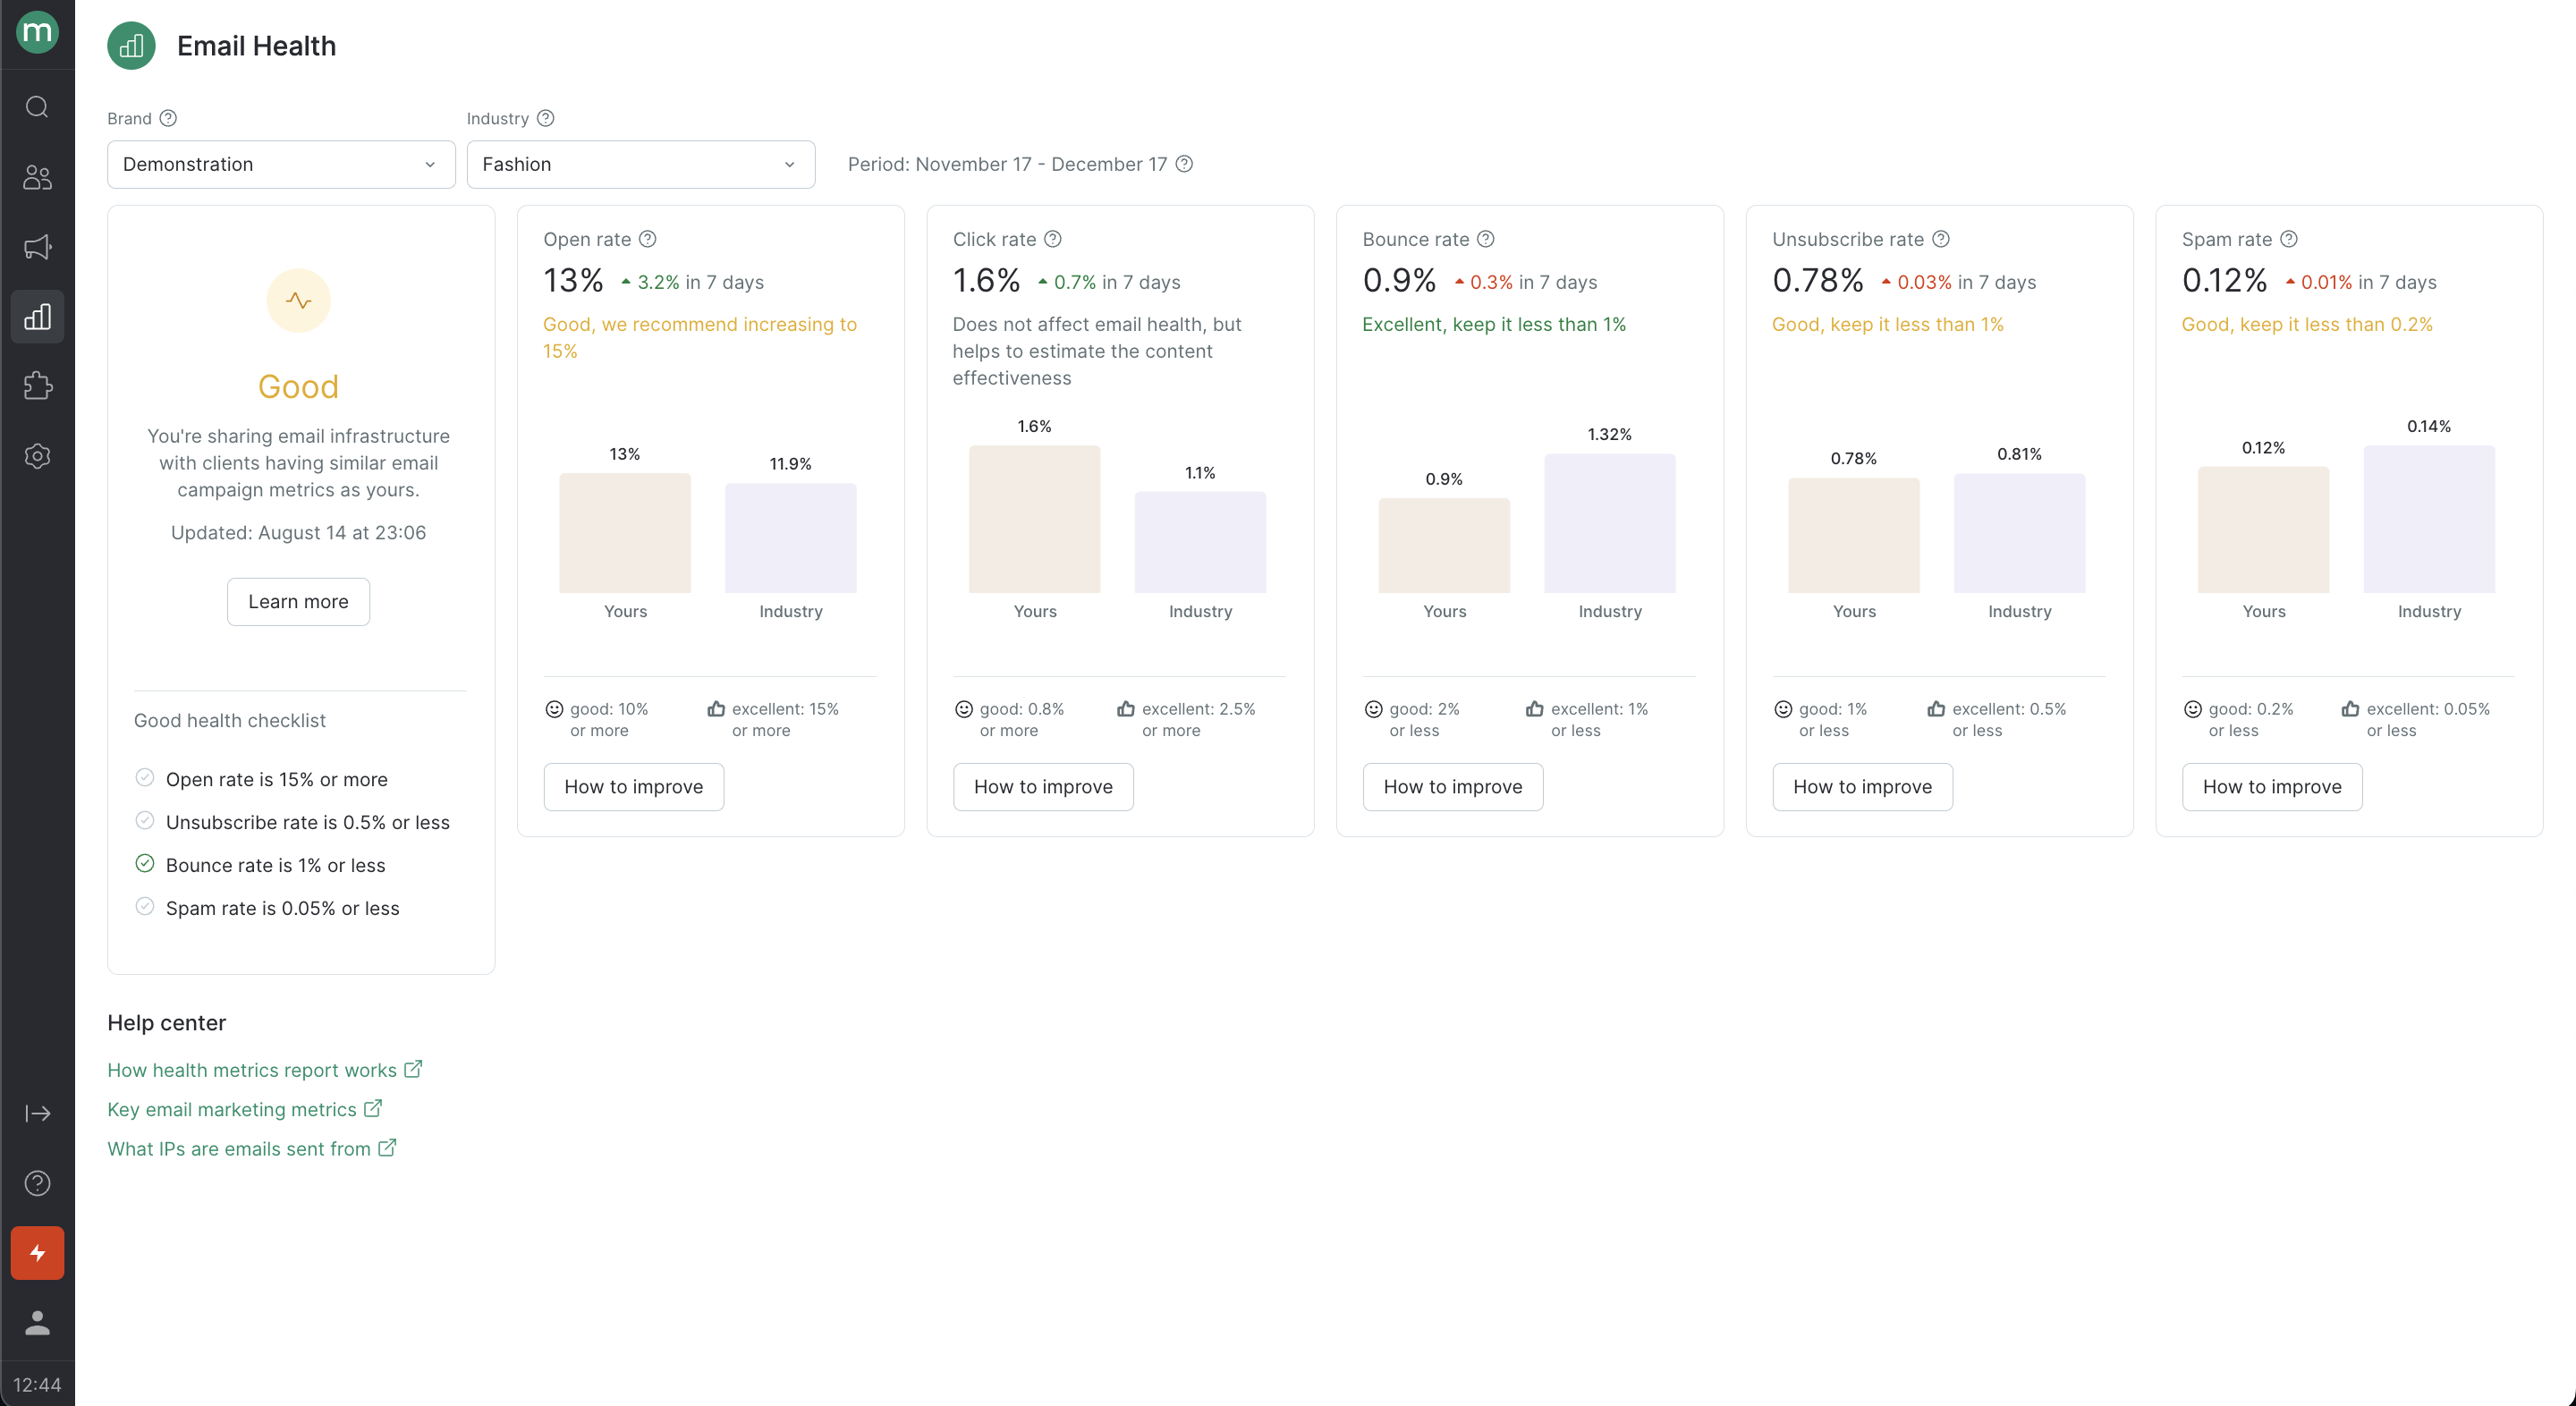
The Email Health report allows you to quickly view and assess the key metrics that affect your email deliverability rate, including:
- Open rate (OR).
- Click rate (CR).
- Unsubscribe rate.
- Bounce rate.
- Spam rate.
Email services such as Gmail or Yahoo look at these metrics upon receiving an email to determine which of the customer’s inbox folders to place it in.
Deliverability metrics show your subscribers’ engagement and eagerness to receive your emails, as well as your email list quality and your compliance with email service recommendations for email ad campaigns.
The report displays the following for each metric:
- The metric percentage based on data collected over the last 30 days.
- The median value for all Maestra clients.
- How the metric has changed over the last 7 days.
- A "How to improve" button for each metric, which can suggest actionable steps to improve scores if they drop.
The report rates your email health as "Poor," "Good," or "Excellent" based on your KPIs.
Assessing the health of your emails has an impact on the set of IP addresses used to send your emails. This assessment is carried out to prevent customers who are in different segments based on activity and quality from impacting one another. Read more about IP groups in this article.
Your email health score
Your email health score is calculated based on the KPIs as follows:
- "Excellent" if all the rates are excellent, and "Good" if they are good.
- "Poor" if at least one rate is rated as poor.
These are the Email Health report thresholds that we recommend you to use as a benchmark:
| OR | CR | Hard bounce rate | Unsubscribe rate | Spam rate | |
|---|---|---|---|---|---|
| Excellent | 15% and more | 2.5% and more | 1% and less | 0.5% and less | 0.05% and less |
| Good | 10% and more | 0.8% and more | 2% and less | 1% and less | 0.2% and less |
| Poor | 10% and less | 0.8% and less | 2% and more | 1% and more | 0.2% and more |
Key metrics for email campaigns
Let’s take a closer look at the key metrics.
| Metric | Recommendations |
|---|---|
| Open rate. This is the ratio of unique opens to messages delivered. A high open rate means that your customers are engaging with your emails, which has a positive impact on deliverability rate. | How to increase your open rate |
| Click rate. This is the ratio of unique clicks to messages delivered. A high click rate also means that your customers are engaging with your emails. However, mailing services don’t consider click rate percentage as important as the open rate percentage. | How to increase your click rate |
| Unsubscribe rate. This is the ratio of people who unsubscribed to the total number of messages delivered. If your unsubscribe rate percentage is high, this shows mailing services that customers are receiving irrelevant content or that they didn’t give their permission to get your emails. As a result, your deliverability rate suffers. | How to reduce your unsubscribe rate |
| Bounce rate. This is the ratio of undelivered messages (due to the addresses being invalid) to the total number of messages sent. This metric helps you assess the quality of your email list. A high hard bounce rate indirectly shows that either your email list is outdated, your subscribers didn’t opt-in to receive your emails, or they didn’t confirm their subscription. | How to reduce your bounce rate |
| Spam rate. This is the ratio of messages reported as spam to the total number of messages delivered. Mailing services view spam reports as a customer action that negatively impacts deliverability. | How to reduce your spam rate |
How to improve your deliverability rate
Each metric in the Email Health report has a "How to improve" button, that leads you to a Recommendations section where you can access the following:
- More detailed metrics for bulk and automatic email campaigns that pinpoint areas for improvement.
- Best practices for improving metric performance.
- Links to articles on segmenting your email list and improving deliverability.